


Webster Collins, CB Richard Ellis/New England
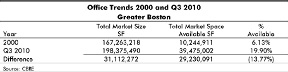
Chart: Office Trends 2000 and Q3 2010 Greater Boston.
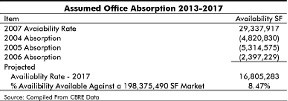
Chart: Assumed Office Absorption 2013 - 2017.
The purpose of this article is to attach meaning to what has happened; in particular in Boston's largest market - office space. I will start by describing:
* What has happened Q4 2007 to Q3 2010?
* Describe the supply and demand equation.
* Predict when that mythical point of equilibrium can be reached and attach meaning.
Q4 2007 to Q3 2010
In Q3 2010, the markets turned positive. Quarterly absorption alone was 701,605 s/f, more than making up for negative absorption Q1 and Q2. For Q4 2010, momentum continues with major leases being signed in Downtown, Cambridge and Waltham. Like Bill McCall, I am a "demand guy" and demand is turning positive in a big way. I attend bi-weekly broker meetings and to feel the energy in that room is exhilarating.
The problem is not the demand side. Boston's economic engine is full speed ahead on all cylinders. As is seen in the Office Market Statistics chart, the problem is the availability side; i.e., the supply.
The Supply Side
In 27 months from Q4 2007 to Q3 2010, 10,137,085 s/f of office space came on the market. While we have a wonderful economic engine on the demand side, just look at what the huge supply of capital available for real estate these past 10 years has done to supply (see Office Trends 2000 and Q3 2010 chart.)
In 2000, our markets had reached that mythical point of equilibrium with 6.13% availability. The office market grew in size by 18.6% in ten years. Space availability grew by 17.5% over the same period for a true net absorption of only 1.1%.
We added 31.112 million s/f in space thinking that the year 2000 equilibrium point would continue. Instead, Boston was hammered by the 2001-2003 "Dot-com Bust" and the 2007-2009 "Great Recession." We way overbuilt our market.
What happens when office markets collapse is two-fold?
* Markets shrink toward such prime locations as Waltham, MIT in Cambridge, and Boston's Financial District.
* Those properties left largely vacant in the Rte. 495 and other hinterlands sell at 20-30 cents on the dollar.
Prediction on Equilibrium
If we assume that the same absorption which took place in the 2003-2007 turnaround takes place following the Q2 2013 recapture of jobs lost since Q4 2007, and that no new office space is built, the following would be the result (see Assumed Office Absorption chart.)
This assumes no new construction will take place, which will not be the case.
Thus, the earliest we can reach equilibrium is predicted to be 2017 under the hypothetical assumption of no new construction. Rent growth from the current downtown class A average asking rent of $45.37 per s/f up to close to $70 per s/f is required before the city can justify new tower construction.
The problem is that every time Boston is buffeted by recession, rents are driven down to low numbers, which upon recovery never return to a point where they can recapture inflation that has taken place in between. That real estate is a hedge against inflation is proving to be a myth.
The key point is that owners with capital who reinvest to keep their buildings competitive in highly volatile markets can benefit by Boston's recovery engine.
Real estate is not homogenous and there will be those who benefit as our office market works back to a more stable platform than experienced these past 10 years.
Webster Collins, MAI, CRE, FRICS, is executive vice president within CB Richard Ellis Valuation and Advisory Group, Boston, Mass.
