


 Many people who work and participate in the commercial and multifamily mortgage industry are all too familiar with the term “Wall of Maturities.” It consisted of a wave of nearly $400 billion in commercial real estate mortgages that were scheduled to mature in 2016 and 2017, many of which were 10-year loans originated in the peak times of 2006 and 2007. While many will point to the loose underwriting standards that helped fuel the CMBS market at the time, there was also another contributing factor why borrowers were so eager to lock in long-term – the yield curve.
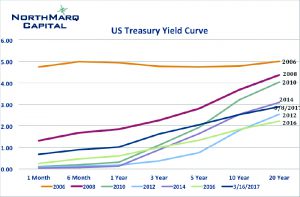
For this discussion the chart above shows the average annual yield curves for selected years. Back in 2006 and 2007 the yield curve was not only flat but was actually slightly inverted. This caused many borrowers to choose to lock in longer term deals since there was no additional rate premium for locking in 10 years versus 5. In fact, due to the marketability of different CMBS securities, many 5-year loans were priced wider than 10-year deals.
 Michael Chase - NorthMarq Capital
Once the recession hit in 2008 the FED dropped short-end rates to 0% in an effort to provide economic stimulus. This corrected the inverse yield curve from 2006 and 2007, but it did not normalize the curve. Instead, knowing that such short-term rates were not likely going to last forever, a significant spread was created between short and long-term rates. The chart above includes the average annual yield curve from 2010, which marks when the recovery started to take place in the U.S. and the yield curve was at its steepest. At that time the spread between the 5 and 10-year U.S. treasury reached 150 basis points!
While the yield curve has trended towards normalization over the past several years, the spread between short and long-term rates has led many borrowers to elect short-term or even floating rate debt. Even while long-term rates have been at historic lows, the opportunity cost of paying a higher rate during the early part of the loan term kept some borrowers from locking in.
On March 15th the FED made its first of what are expected to be multiple adjustments to the Benchmark rate in 2017. As we know, the yield curve is not a straight line, so movements at the short-end do not always evenly translate throughout the curve. There is still significant downward pressure on long-term rates. Following the FED’s announcement long term rates actually decreased slightly with the 10-year U.S. Treasury dipping from 2.6% to 2.5%. As of March 17, 2017, the 10-year U.S. treasury yield is at 2.5%, while the German 10-year bond is yielding 0.45% and the Japanese 10-year bond is at 0.08%. The relative value of U.S. treasuries in the global marketplace is likely to keep long-term U.S. rates in check.
So what does this mean? As the FED moves short-term rates, the downward pressure on long-term rates is likely to continue the trend of a flattening yield curve. Borrowers may once again see the benefit from being able to lock in long-term deals at an attractive risk adjusted premium versus the shorter term deals that have been so attractive over the last several years.
Michael Chase is a senior vice president with NorthMarq Capital, Boston.
