
News:
Spotlight Content
Posted: August 30, 2019
Boston considered to be among most competitive industrial real estate markets in the country - by Kevin Olson

Nordlund Associates
Overall, commercial real estate in Boston is thriving and there is an abundance of new developments and real estate opportunities for brokers, tenants, landlords, and investors to capitalize. BizJournals recently highlighted why Boston’s commercial real estate market remains robust moving into 2019. Of the many reasons listed, the greatest factor is the stability of the economy over the last 40 years in contrast to many markets across the U.S. The analysis concludes that “Overall, the future for Boston CRE will provide healthy competition for brokers and tenants alike.”
More specifically, Boston is considered to be among the most competitive industrial real estate markets in the country. It is seen as a prime location with opportunities for both investors and tenants due to its positive market fundamentals and bourgeoning sectors, such as biomedical, healthcare, education, technology, and finance.
In fact, National Real Estate Investor ranked Boston’s warehouse market 11th nationwide in a recently published list of “Warehouse Markets with the Most Rent Momentum.”
Demand for industrial real estate in the Greater Boston area remains high, especially for well-situated distribution spaces and high-end manufacturing spaces. Led by the expanding biopharmaceutical industry, tenants have absorbed a total of 8.9 million s/f of industrial space over the last 6+ years (since 2012).
The overlying theme in Q2 2019 is how tight the industrial real estate market is north of Boston. This is specifically illustrated by the stats listed for the industrial real estate properties in the North Shore area.
Over the past few years industrial real estate has become increasingly competitive, vacancy rates have steadily declined to a low single digits number in Metro Boston and the suburbs surrounding, thus driving prices upward with this lack of inventory. We’ve seen these factors create an opportunity for new construction and development, firms willing to develop property or scrape existing dated structures, that were previously considered prohibitive due to incurring higher construction costs.
There are several driving factors which have played a role in this scarcity, greater Boston and the suburbs have one of the most dynamic & diverse collection of industries such as healthcare, tech, and education. The rise of E-commerce, the retail model and its relationship with consumer has changed tremendously over the last five years, creating opportunity for fulfillment centers as well, with their shipping and receiving demands.
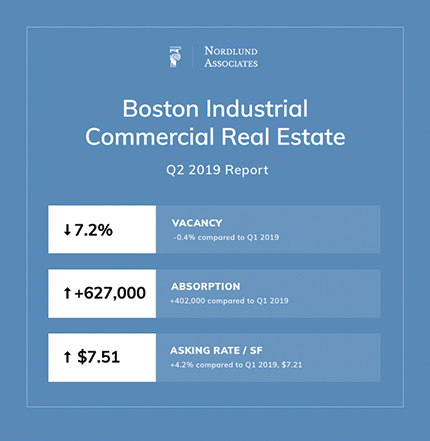
Key stats: Boston
• Vacancy: 7.2% (-0.4% compared to Q1 2019)
• Absorption: +627,000 (+402,000 compared to Q1 2019)
• Asking rate / SF: $7.51 (+4.2% compared to Q1 2019, $7.21)
Boston Industrial Real Estate: Market Share by Space Type
1) Warehouse – 43%
2) Flex – 20%
3) Manufacturing – 19%
4) High Bay (24' Clear) – 18%
Top industrial properties under construction: Boston
Most of these projects are set to be completed within the calendar year in 2019.
1) 333 Coney St. – Siemens Expansion (Rte. 495 South industrial market)
RBA: 300,000
Preleased: 100%
Delivery Date: Q2 2021
Developer: Siemens Healthcare Diagnostics Inc.
2) 100 Financial Park (Rte. 495 South industrial market)
RBA: 300,000
Preleased: 0%
Delivery Date: Q3 2019
Developer: Unknown
3) 237 E Main St – Building 5 (Attleboro / New Bedford)
RBA: 258,000
Preleased: 0%
Delivery Date: Q3 2019
Developer: Condyne LLC
4) 20 Commerce Way – Alnylam, Attleboro / New Bedford
RBA: 200,000
Preleased: 100%
Delivery Date: Q4 2020
Developer: Gilbane Development Co.
5) 237 E Main St. – Building 7, Attleboro / New Bedford
RBA: 130,000
Preleased: 0%
Delivery Date: Q3 2019
Developer: Condyne LLC
Top industrial sales transactions: Boston during Q2 2019
1) 108 Cherry Hill Dr., Beverly.
Price: $76 million ($193 per s/f)
Buyer: Broadstone Real Estate, LLC
2) 30 Superior Dr., Natick.
Price: $51.7 million ($299 per s/f)
Buyer: Bentall Kennedy
3) 159 Rangeway Rd. / 400 Charter Way, Billerica.
Price: $25.5 million ($176 per s/f)
Buyer: Store Capital Corp.
4) 370 W First St., Boston.
Price: $25 million ($1,717 per s/f)
Buyer: Oxford Properties Group
5) 1 Kay Way, Stoughton.
Price: $17.25 million ($165 per s/f)
Buyer: Morgan Stanley Real Estate
6) 330 Ballardvale St., Wilmington.
Price: $9,157,725 ($213 per s/f)
Buyer: Angl Jerky LLC
Top industrial leases 2018: Boston
1) 419 Maple St. (I-95 Corridor South Ind)
SF: 489,950
Tenant: BlueLinx
Landlord: Unknown
2) 64 Jackson Rd. (Ayer Ind)
SF: 355,000
Tenant: Quiet Logistics
Landlord: Newmark Knight Frank
3) 305 Forbed Blvd. (Attleboro / New Bedford Ind)
SF: 302,032
Tenant: Rolf C Hagen (USA) Corp.
Landlord: CBRE – New England
4) 66 Saratoga Blvd. (Ayer Ind)
SF: 261,982
Tenant: Gillette Eastern Distributors
Landlord: CBRE – New England
5) 55 Lyman St. (The Boroughs Ind)
SF: 260,760
Tenant: McKesson Corp.
Landlord: CBRE – New England
Market Snapshot for Industrial / Flex Space North of Boston
Nordlund Associates conducted a study of industrial and flex space properties within a five mile radius of Massachusetts’ North Shore to get a better idea of this specific zone in contrast to the whole Boston metropolitan area. Although rates are a bit higher around North Shore ($10.46 per s/f vs. +$7.51 per s/f) on average, the vacancy rate is also lower by over 50%: 3.9% vs. 7.2%, respectively.
The big takeaways are the asking price at $10.46 (+8.6% compared to Q1 2019 at $9.62), and the market sales price / s/f which increased 10% from quarter-to-quarter to $105 per s/f (compared to $96 per s/f in Q1 2019).
These help illustrate how tight the industrial/ flex market is in the Massachusetts’ North Shore area and how desirable properties are in the area.
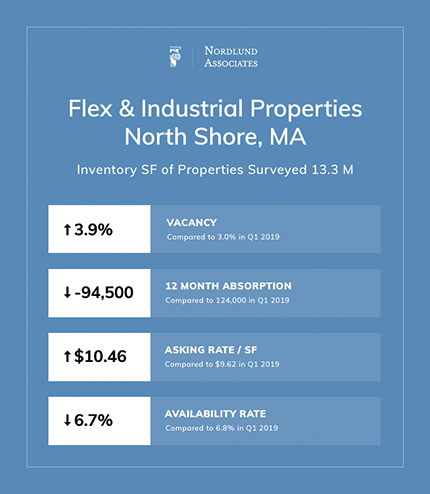
Key stats: Flex & Industrial Properties – North Shore, Mass.
• Vacancy: 3.9% (compared to 3.0% in Q1 2019)
• 12 month absorption: -94,500 (compared to 124,000 in Q1 2019)
• Asking rate per s/f: $10.46 (compared to $9.62 in Q1 2019)
• Market cap rate: 6.7% (compared to 6.8% in Q1 2019)
*Inventory s/f 13.3 million
Top industrial highlights: North Shore (Boston)
1) System7 – 48 Dunham Rd., Beverly.
Description: System7 is the first tenant occupying 145,000 s/f in the Class A asset completed in Q4 2018
2) The Hanover Company – 269-271 Mill Rd., Chelmsford.
Description: The Hanover Co. acquired the 268,000 s/f property for $35 million ($132 per s/f).
3) Symes Associates – 99 Rosewood Dr., Danvers.
Description: Symes Associates purchased the 74,000 s/f property in Danvers for $7.2 million ($97 per s/f).
Kevin Olson is a senior advisor for Nordlund Associates Inc., Danvers, Mass.
Data sources: Steel by CoStar, Perry Brokerage, Colliers, & Nordlund Associates
Tags:
Spotlight Content
MORE FROM Spotlight Content

Participation opportunities for our Industrial Review 2026
The New England Real Estate Journal is pleased to announce participation opportunities for our upcoming Industrial Review 2026, a special publication highlighting the people, projects and properties shaping New England’s industrial real estate market.


 (1).gif)


Columns and Thought Leadership

Limited supply fuels landlord‑friendly conditions in Rhode Island’s industrial market - by Julie Freshman and George Paskalis
As we enter the spring of 2026, the Rhode Island industrial real estate market stands on stable footing, following several years of resilience fueled by constrained supply, steady demand, and dynamic economic conditions.

As legacy names recalibrate, new entrants are moving in with fresh capital, new technologies, and business models tailored to today’s supply-chain needs - by Michael Harrington
Southern New Hampshire’s industrial market has always punched above its weight. For decades, the region has attracted a mix of advanced manufacturing, beverage and food producers, logistics operators, and specialty

Shallow-bay wins on 495/128: A renewal-driven market with a thin pipeline - by Nate Nickerson
The Boston industrial market entered mid-2025 in a bifurcated state. Large-block vacancy remains elevated, while shallow-bay along the 495/128 corridor continues to prove resilient. Fieldstone’s focus on this geography positions us squarely in the middle of a renewal-driven, supply-constrained

How do we manage our businesses in a climate of uncertainty? - by David O'Sullivan
These are uncertain times for the home building industry. We have the threat of tariffs mixed with high interest rates and lenders nervous about the market. Every professional, whether builder, broker, or architect, asks themselves, how do we manage our business in today’s climate? We all strive not just to succeed, but
