

Buildings along Rte. 2 outside of I-495 have typically been passed up by investors in the past. After tracking some data, there seem to be a number of indicators that could predict an increase in prices and sales volume in this market.
Buildings in this market that have criteria attractive to investors (proper loading ratios, high ceiling heights, and proximity to the highway) could see sustained increase in value as demand continues to be high. Recent sale values seem to be setting new precedents with, what seems like, little regard for historical sale values.
As investor appetite continues to be sustained at high levels, interest is moving West, outside of I-495.
The following charts are generated by data from the Rte. 2 corridor outside of I-495.*data excludes Devens
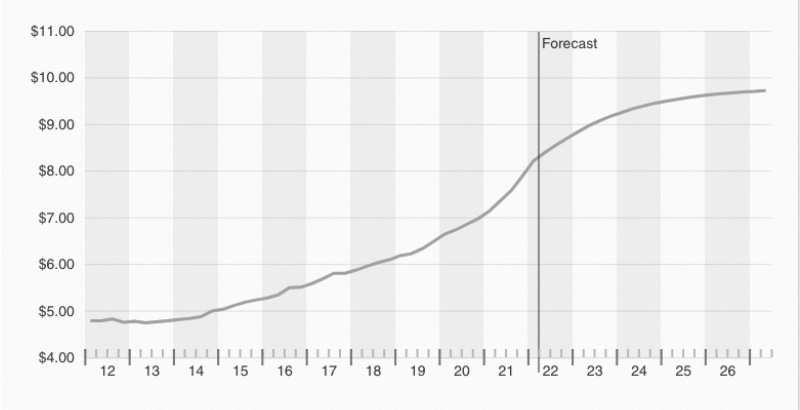
Market Rents
We can see in this chart, that market rents have been accelerating rapidly for the past five years. Rates are at an average of +/- $8.25 and are forecasted to continue to increase. There has been a sharper uptick in rent increase just in the last two years. This has been in part, due to typical inflation/expected rent growth, but mostly due to the increase in e-commerce sales, and razor thin vacancy rates. Companies along I-495 have begun getting priced out of their buildings and are moving westward.
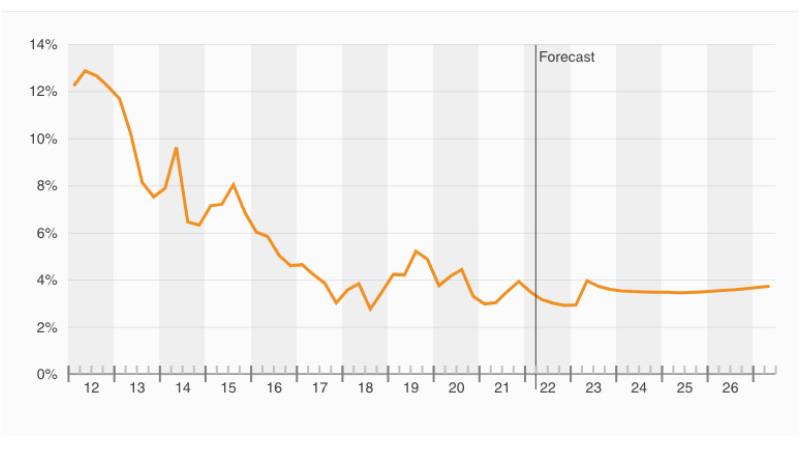
Vacancy Rate
Vacancy rates have continued to decline and have stayed fairly consistent at sub 4% levels for the past two years, which is very low. Data predicts this will be sustained in the future. It is theorized that for every $1 billion in e-commerce sales, there is a need for 1.2 million s/f of warehouse space. We can see this in effect over the last decade as e-commerce has boomed. This has also been coined “the Amazon effect”.
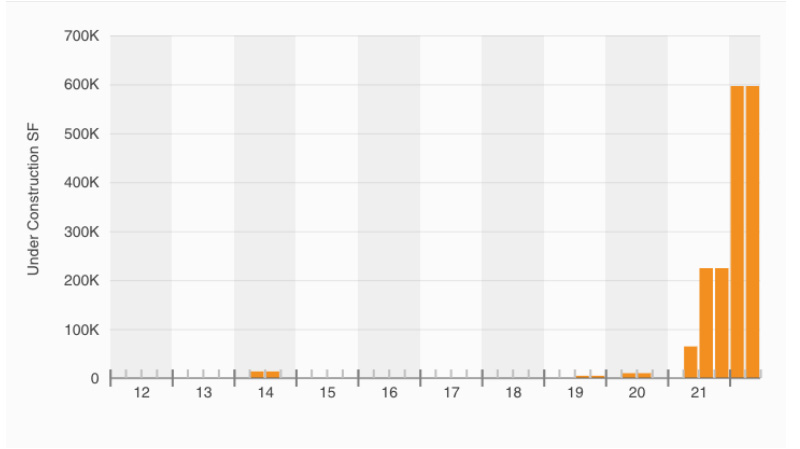
Under Construction / Proposed
Historically, development for institutional grade distribution product has not been sought after along Rte. 2, with the exception of Devens, and a couple of other buildings along Rte. 2. This has changed. The lack of available product, and feasible land sites inside I-495 has dwindled causing investors and developers to get creative.
The demand is so strong that there have been office buildings demolished to accommodate a high-bay warehouse. (50 Nagog Park, Acton)
The chart above shows that for the past decade, there has been almost no new development in the market. However, this has changed in 2021 and 2022. Currently there is 1.2 million s/f of warehouse under construction or proposed along Rte. 2. The majority of it being in Lancaster, and Westminster.
Average Market Sales Price Per s/f
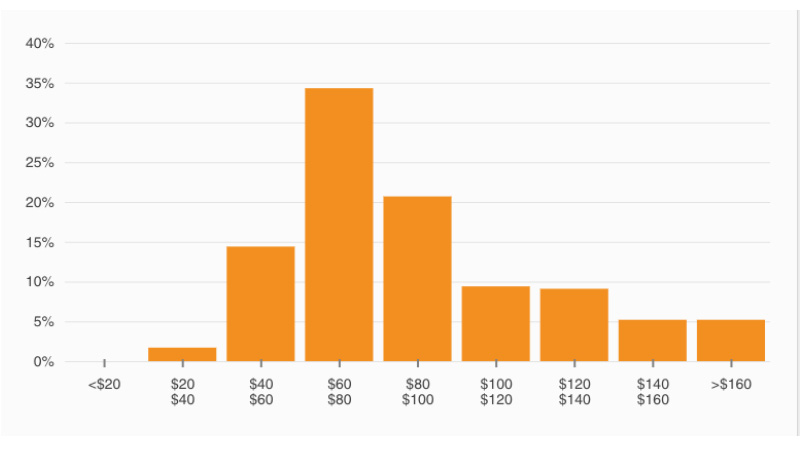
Market Sale Price Per s/f Distribution
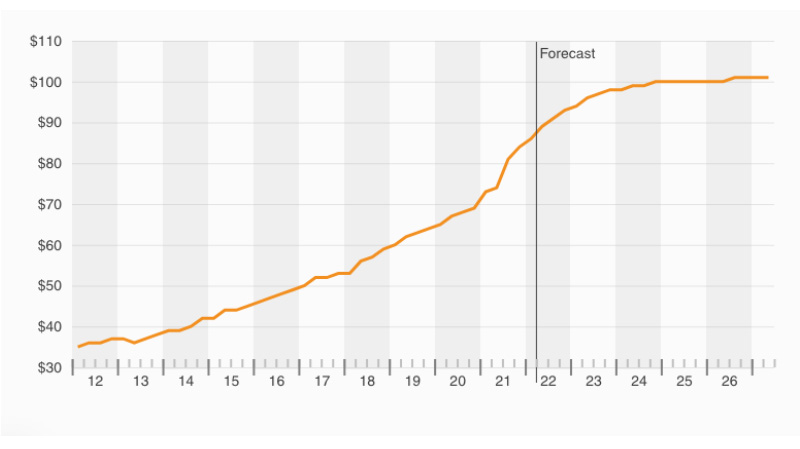
We can see that the current average price per s/f is at +/- $87. The average price per s/f prior to COVID-19 was +/- $65.
Although there has been a dramatic increase in overall average price per s/f, the majority of buildings are still selling in the $60-80 range. Specific comps show us that the median number is around $70.
For smaller industrial buildings less than 15,000 s/f - the prices per s/f are even rising more - two buildings smaller than 10,000 s/f that sold for over $115 per s/f in 2022.
Analysis
I fully expect that median per square foot price to raise from $70 into the high $80s and into the $90s. Some buildings with clear height over 16’, high loading dock ratio, and open, clear space will see prices soar into the low $100s.
The reason this can be forecasted is due, in part, to the macro elements at play specifically inflation and liquidity. BisNow National wrote an article at the end of 2021 explaining that private equity had a total of $288 billion in cash ready to invest in CRE (https://tinyurl.com/mr3dbxdn).
This “army chest” of capital has had an impact in the Greater Boston market. PE firms are buying up the institutional grade assets which mainly exist along Rte.128, I-93, Rte. 3, I-90 and I-495 - each sale setting a new price record.
The average rent along I-495 and Rte. 3 is +/- $12.00 and has an average sale price of $155 per s/f with 52% of buildings being sold between $120-180 per s/f.
The average rent along Rte. 128 and I-93 is sitting at +/- $14.00 and the average price just under $200 per s/f with 54% of buildings selling between $150-210 per s/f.
As stated above the average rent along Rte. 2 is +/- $8.25 and the average price is $87 per s/f with 55% of sales trading between $60-100 per s/f.
Just by using average rents and average sale price per s/f I-495 and Rte. 3 has an average cap rate of 7.74% (12.92X multiple)
Rte.128 and I-93 has an average cap rate of 7% (13.93X multiple) Rte. 2 has an average cap rate of 9.48% (10.55X multiple)
Conclusion
I believe this data is showing that from a 10,000 foot level, this market is undervalued. We have already started seeing local, Mass.-based investors, recognize the opportunity in value and begin buying up buildings in the towns along Rte. 2 that have been historically overlooked like Ayer, Lancaster, Lunenburg, Leominster, and Westminster.
Institutions and private equity have just begun deploying capital in this market. For example a portfolio of two industrial buildings in Jytek Park, Leominster, just sold to an institutional firm for $14.65 million or $125 per s/f. 25 Tucker Dr., Leominster a 544,000 s/f warehouse also transacted recently for $113 per s/f to a local buyer deploying institutional money. Another transaction to note is the 400,000 s/f Aubuchon Hardware warehouse building in Westminster that transacted for $64 per s/f at the end of 2021.
These early indicators of local buyer groups, will signal larger pools of capital to enter the market - which will drive sales volume and sale value up.
Certain macroeconomic factors like rising interest rates are certainly something to watch. If leases are structured to accurately escalate on pace with market rental rates/inflation, then current values should not be impacted, however, we could see a cool off in sale price percentage growth overall.
If you are a building owner along Rte. 2 or surrounding markets and are planning on selling your building in the next few years, it will be important to start planning now to ensure maximum market value.
Nate Nickerson is president and managing broker of Fieldstone Commercial Properties, Inc., Medford, Mass.

 (1).gif)


As we enter the spring of 2026, the Rhode Island industrial real estate market stands on stable footing, following several years of resilience fueled by constrained supply, steady demand, and dynamic economic conditions.