News:
Connecticut
Posted: June 18, 2015
Hartford County commercial real estate review
The commercial real estate market in Hartford County was impacted by the recession that began in December 2007 and ended in June 2009. In order to determine where we stand in the real estate cycle, sales activity over the past 10 years (2005-2014) has been reviewed by property type. All building sales in the industrial, office and retail markets greater than 5,000 s/f with a sale price over $100,000 have been considered.
Industrial Market
The number of sale transactions in the industrial market ranged between 40 and 94, with an average of 67 sales per year over the 10-year period surveyed. The number of sales peaked at 94 in 2005 and declined to 40 in 2010. The number of sales did spike to 70 in 2011 and have since declined to 56 in 2013 and 57 in 2014, below the ten year average.
Over the past ten years, the overall sales volume has averaged approximately $126.4 million per year. The sales volume peaked in 2007 at $260.7 million and reached a low of $39.1 million in 2010. The transaction volume did increase to $103.9 million in 2011 and again to $163.1 million in 2012. The total sales volume stood at $79.4 million in 2014, which is below the indicated average and an increase over the 2013 figure of $68.5 million.
The industrial market has achieved an average sale price per square foot of $35.88 between 2005 and 2014. The average price per square foot reached a low of $19.53 in 2010 and a high of $48.38 in 2009. However, the average building size in 2009 was only 23,000 square feet versus the 10 year average of approximately 50,000 square feet. Smaller industrial buildings typically achieve a higher price per square foot and the indicated figure for 2009 was impacted by the atypically small average size of the sale properties. Excluding 2009, the price per square foot illustrates a peak of $46.79 in 2007. Since the bottom in 2010, the average sale price per s/f did increase in 2011 ($29.74) and again in 2012 ($40.17). However, the average price per s/f has declined since 2012 to $35.76 in 2013 and to $28.37 in 2014.
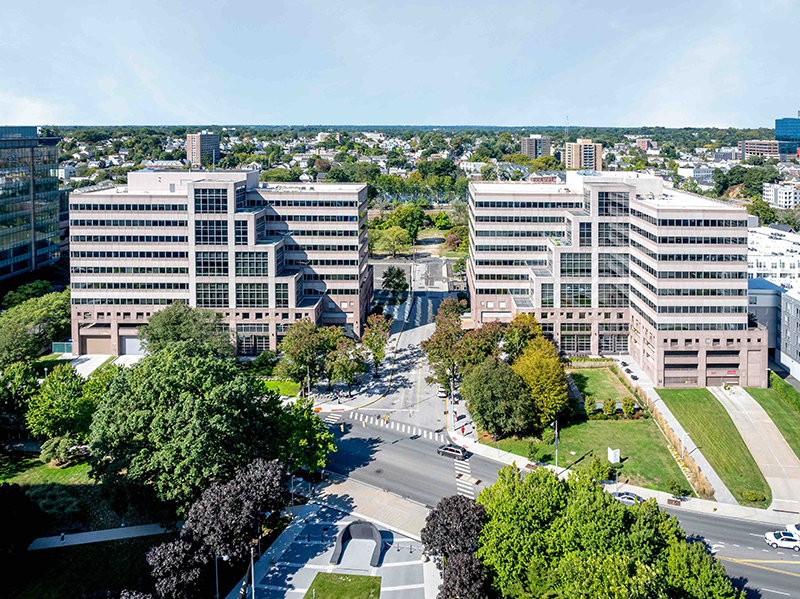
Office Market
The number of sale transactions in the office sector has average 49 per year with a peak of 69 in 2005 and a low of 26 in 2011. Over the past three years, the number of sales has ranged from 50 in 2014 to 55 in 2012, above the indicated ten year average of 49.
While the number of sales peaked in 2005, the transaction volume did not peak until 2006 at $273.7 million. Sales volume declined to $42.6 million in 2011 and averaged $181.1 million over the past ten years. Since the low in 2011, sales volume spiked to $258.8 million in 2012 before declining to $187.3 million in 2013 and to $176.8 million in 2014. The indicated sales volume in 2013 and 2014 approximates the average.
The office market has achieved an average sale price per s/f of $69.16 over the past ten years, with a low of $49.58 in 2010 and a high of $86.77 in 2007. The average price per s/f did increase to $83.79 in 2012 and has declined to $62.19 in 2013 and to $56.98 in 2014. The most recent figures are below the indicated average.
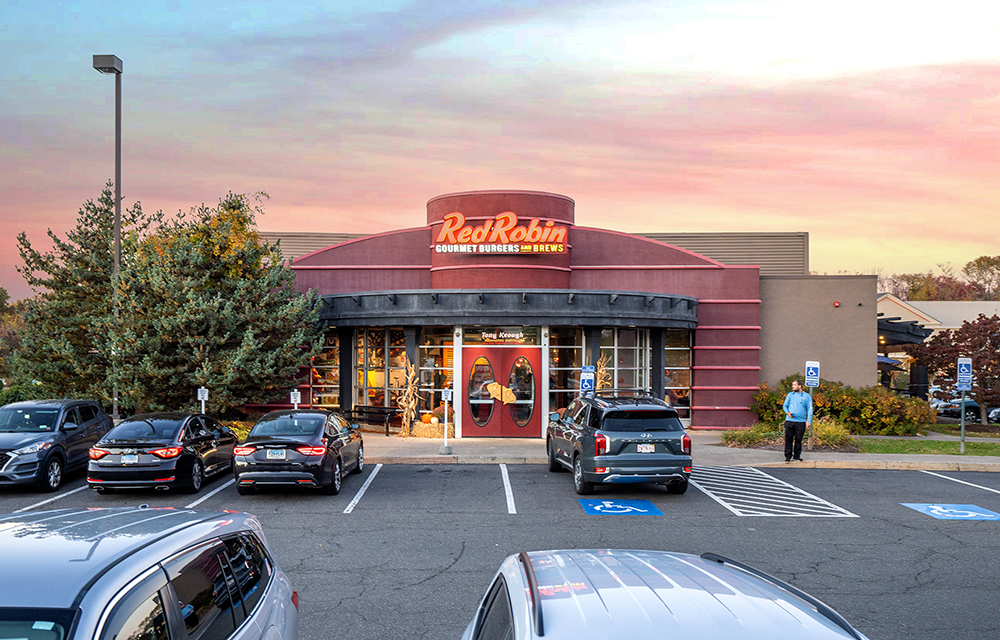
Retail Market
The retail market has experienced between 25 and 56 transactions over the past ten years, with a peak of 56 sales in 2005. The number of sales declined to 25 in 2008, 2009 and 2014. The retail market has average 34 sales per year over the past ten years.
Sales volume also peaked in 2005 at $401.1 million and declined to $66.6 million in 2010. The overall volume did increase to $193.6 million in 2013, above the indicated average of $161 million. However, it has since decreased to $102.8 million in 2014.
Over the past ten years, the average price per s/f in the retail market has ranged between $70.86 and $172.26, with an average of $121.72. The low was experienced in 2011 and the high was recently experienced in 2014. The indicated sale price per square foot in 2014 was influenced by the presence of high priced pharmacy sales. Nonetheless, the indicated sale prices per square achieved in 2012 ($123.14) and 2013 ($125.50) were above the 10 year average.
The industrial market clearly peaked in 2007 and bottomed out in 2010. Total transactions, sales volume and the average sale price per s/f experienced in 2014 are all below the ten year average. The office market peaked between 2005 and 2007 and reached bottom in 2011. As of 2014, the office market was generally on par with the 10-year averages for number of sales and transaction volume, while the sale price per s/f was below the ten year average. Within the retail section, the number of transactions and overall volume peaked in 2005, with the 2014 figures below the ten year averages. The retail market reached bottom between 2009 and 2011. From a sale price per square foot perspective, the retail market peaked in 2014, with the 2012 and 2013 figures exceeding the ten year averages.
FRQ Property Advisors, LLC is a commercial real estate appraisal and consulting company located in Hartford, Connecticut. The firm specializes in the analysis of commercial real estate, with an emphasis on multi-tenant income producing property, including office, retail, industrial and mixed-use developments. The company's mission is to provide unbiased, credible valuation services in a timely manner.
Rocco Quaresima, MAI, is principal of FRQ Property Advisors, LLC, Hartford, Conn.
Tags:
Connecticut
MORE FROM Connecticut
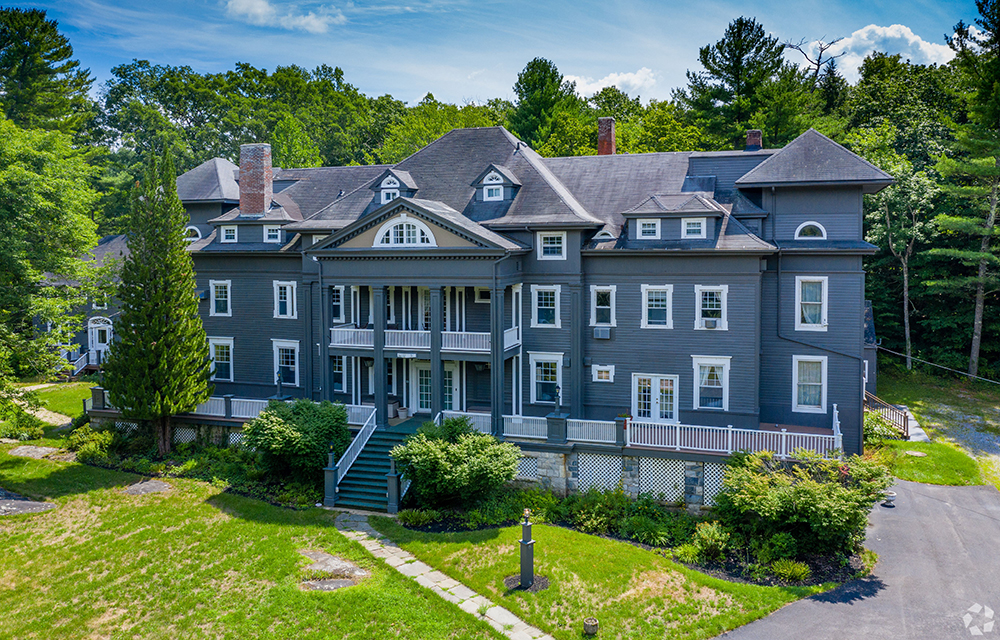
Galton of Houlihan Lawrence sells 15,800 s/f Wake Robin Inn for $3.5m
Lakeville, CT Houlihan Lawrence Commercial, a division of Houlihan Lawrence, a real estate firm serving Connecticut and New York City’s northern suburbs, has brokered the sale for $3.5 million of the Wake Robin Inn, a 15,800 s/f historic inn located on 11.52 acres at 106 Sharon Rd.


Quick Hits