News:
Connecticut
Posted: November 17, 2011
IREM releases new report on federally assisted multifamily properties
Operating expenses in 2010 versus 2009 increased for most federally subsidized multifamily housing properties, including all Section 236 and Section 8 family building types. The year-to-year increases ranged from $.0 1 to $0.45 per s/f of rentable area.
This is among the key findings reported in the 2011 edition of the Income/Expense Analysis: Federally Assisted Apartments, a new benchmarking study published by the Institute of Real Estate Management (IREM). Conducted by IREM since 1986, this annual study analyzes the previous year's operating data for more than 1,019 high-rise (elevator buildings), low-rise and garden-style properties nationwide - containing 89,249 units - that receive one of six types of federal assistance: HUD Sections 202, 221(d)3, 236, Section 8 Elderly/Handicap and Section 8 Family and Rural Development Section 515. It is designed as a benchmarking and planning tool to help owners and managers of subsidized housing make detailed, accurate comparisons of the performance of properties in their portfolios. It also can be used as a resource for developing appraisals, acquisition or sales proposals, feasibility studies and loan requests.
UTILITY COSTS UP AND DOWN
Utility costs across most types of federally subsidized multifamily buildings rose in 2010 from the year earlier, with increases ranging anywhere from $0.03 to $0.22 per s/f. In contrast, three building types experienced decreases ranging from $0.19 to $0.42 per s/f. Section 202 garden buildings reported the lowest utility costs at $0.73 per s/f. Section 236 elevator buildings reported the highest such costs at $2.27 per s/f.
MAINTENANCE COSTS EXAMINED
Median maintenance costs (costs include security and grounds maintenance, but excluding general maintenance payroll) for all elevator and low rise buildings increased last year versus the prior year within a range of $0.01 to $0.19 per s/f, or stayed the same. Maintenance costs for garden-style projects were both up (within a range of $0.11 to $0.13 per s/f) and down (within a range of $0.04 and $0.13 per s/f). Section 221(d)3 garden buildings reported the lowest maintenance costs at $0.30 per s/f. Section 202 low-rise buildings reported the highest maintenance costs at $1.48 per s/f.
OPERATING RATIOS AND NET INCOME EXAMINED
In terms of operating ratios (the total of all expenses divided by total actual collections and expressed as a percentage), all Section 236 and Section 8 Family buildings and two of three Section 202 buildings decreased last year versus 2009, with the remaining buildings reporting both up and down results. The highest operating ratio of 71% was reported Section 236 elevator buildings, whereas the lowest operating ratio of 51% was reported for Section 8 Family elevator buildings.
In terms of net income, Section 202 building categories in 2010 ranged from $2.16 to $8.91 per s/f; Section 221(d) 3 buildings ranged from $3.94 to $7.34 per s/f; Section 236 buildings ranged from $2.38 to $3.88 per s/f; Section 8 Elderly/Handicapped buildings ranged from $4.89 to $5.72 per s/f; and Section 8 Family buildings ranged from $4.32 to $7.47 per s/f.
MUCH LOWER TENANT TURNOVER THAN IN
CONVENTIONAL SECTOR
Federally assisted apartments experienced much lower levels of tenant turnover in 2010 than those in the conventional sector. During the course of the year, subsidized properties reported the number of new tenants moving into their buildings to be 14% of total apartments in elevator buildings, 24% in low-rise buildings, and 27% for garden-type properties. Conventionally financed apartments experienced much higher turnover ratios, ranging from 34% to 53%.
MORE STUDY SPECIFICS
The IREM Income/Expense Analysis research study breaks down operating figures into several categories, such as building type, subsidy type, property size and property age. Regional and city reports are also included.
PRICE AND ORDERING
INFORMATION
The 232-page Income/Expense Analysis: Federally Assisted Apartments is available for $404.95 (plus $15.50 shipping and applicable state sales tax). The IREM Member price is $202.95 (plus shipping and handling). To order, contact IREM's Customer Service Department at 430 N. Michigan Ave., Chicago, IL 60611-4090, or call toll-free to (800) 837-0706, Ext. 4650. Credit card orders (VISA, MasterCard, Discover or American Express) can be faxed toll-free to (800) 338-4736 or e-mailed to custserv@irem.org. Internet users can order the study in soft cover or in a downloadable format by accessing the Publications section (click on Income/Expense Analysis® Reports on the drop-down menu) of the IREM Web site at www.irem.org. As a special incentive, purchasers of the report in print format can also receive it in downloadable Excel file and PDF format for just $99.99, with the data completely customizable in Excel.
FOUR OTHER 2011 I/E ANALYSIS BENCHMARKING STUDIES AVAILABLE
IREM also has just published new 2011 editions of its four other annual Income/Expense Analysis studies: Condominiums, Cooperatives & Planned Unit Developments ($404.95); Shopping Centers ($449.95); Office Buildings ($449.95); and Conventional Apartments ($449.95). IREM Members receive a 50% discount on each study and member and non-member purchasers of all five studies receive a 15% discount on their total order. In addition, purchasers of any Income/Expense Analysis book can get it in downloadable Excel file and PDF format for only $99.99.
Tags:
Connecticut
MORE FROM Connecticut
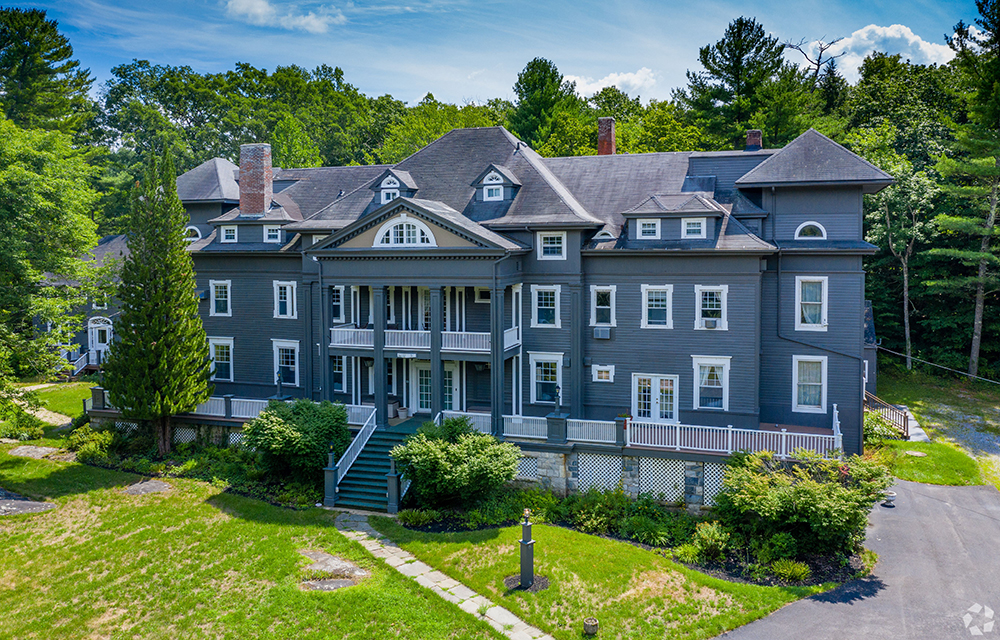
Galton of Houlihan Lawrence sells 15,800 s/f Wake Robin Inn for $3.5m
Lakeville, CT Houlihan Lawrence Commercial, a division of Houlihan Lawrence, a real estate firm serving Connecticut and New York City’s northern suburbs, has brokered the sale for $3.5 million of the Wake Robin Inn, a 15,800 s/f historic inn located on 11.52 acres at 106 Sharon Rd.


Quick Hits