 (1).png)
News:
Owners Developers & Managers
Posted: December 8, 2017
NAIOP/SIOR End Of The Year Commercial Market Review: 2017
Boston, MA The New England Chapter of the Society of Industrial and Office Realtors (SIOR) and MA NAIOP held its end of the year market review and 2018 commercial real estate forecast at the Westin Hotel in the Seaport on November 29. The main speaker included Barry Bluestone, professor of Public Policy, Northeastern University on the economic overview. Panelists included Ben Sayles, HFF on the capital markets; Molly Heath, JLL on the Cambridge market; John Carroll, Colliers on the suburban market; Ron Perry, Avison Young on the Downtown Boston market and Jr McDonald, Newmark Knight Frank on the industrial market. Over 420 area commercial real estate practitioners attended this event.
Here is a summary from the panel of experts of the relevant points as it relates to 2017 and 2018.
Bluestone: Economic Overview: Bluestone started the program comparing the U.S. vs. the Boston growth in real output. Massachusetts has been outpacing the U.S. since the recession showing the strength of the state’s economy. Massachusetts has added 260,000 workers and is at full employment with a 4% unemployment rate. The 4% is as low as you can get. There is a slight increase in wages despite the low unemployment rate but still today’s wages are 10% less than the higher wages from 10 years ago.
Bluestone stated that since 2010, 284,000 jobs were created in the Boston area. The problem is attracting young workers and retaining them but the housing stock is very limited. The housing stock is growing too slow for the current demand, prices/rents are increasing, housing prices keep rising and are burden and people are moving further outside the Boston area due to affordability. Lawrence, a blue collar old mill town city, has experienced a greater housing price increase than affluent Newton.
The U.S. annual housing sales are up 33% but it will stall out. The condo sales in the inner Boston suburbs are up but condo sales are bigger in blue collar, urban area cities such as Lynn, Haverhill, Framingham, Quincy and Plymouth. These areas outside of Boston have had big sales increases but the movement has created a transportation nightmare.
The stats are down sharply on homeownership from 66.3% in 2013 to 60% in 2016. This downturn is due to young people not being able to afford housing. College tuition is expensive and a burden on young people that has impacted their ability to afford homes. In 2017 housing availability will be the lowest since 2002 with a 0.4% of vacancy rates. Therefore housing prices continue to rise 4-5% per year. Annual price increase were as follow:
2017 = 4.9%
2016 = 4.7%
2015 = 4.3%
2014 = 6%
2013 = 7.2%
In 2017, 2Q experienced an average median price in the Boston area of $447,799. This is up 32% from 2009. From 2009, the increase is up $109,000. In 2009 the average median housing price was $339,123. In comparison, 6 years ago, Bluestone’s hometown of Detroit had an average median housing price of $39,000 and now its up to a whopping $72,000.
Bluestone then researched Home Price Gradient, prices of homes as you moved away from Boston. Five miles from Boston the average price of a home was $775,278 but 40 miles from Boston the average was $366,846, pushing people further and further out but creating traffic chaos back into Boston. Bluestone feels that the home price gradient is flattening because people are leaving the core area and moving way out. But people who want condos want to be in luxury condos in the Seaport area which is much more expensive and not affordable for younger people. Condos however are finally leveling in the Boston area.
Apartment rents are experiencing some improvement. The vacancy rate in 2015 = 3.4% and in 2017 = 4.7%. You need 5.5-6% vacancy to really see any rent stabilization. The average Boston area rents are:
2017 = $2,874 per month
2016 = $2,952 per month
2015 = $2,667 per month
2014 = $2,427 per month
Problem is that the average annual income is $62,000 in inner core so rent is a big burden. Apartment rents are rising faster than housing prices. The median asking rent has increased 27%. In 2015, 50.1% of renters were paying more than 30% of their income towards rent.
Bluestone researched rents in older housing stock. Triple deckers in Cambridge 50 years ago was housing newly arrived immigrants. Now its Millennials. Student housing off campus in the Boston area totals 73,967. Triple deckers now have an average price of $554,957. The price is up 127% since 2009 and many college students live in these triple deckers.
Bluestone then looked at new housing. We are making progress with new housing supply. Boston is experiencing a declining permitting time as the Mayor is pushing to reach 53,000 new housing units by 2030. We are on track to reach that goal. There has been an increase in the number of Boston area housing permits. In 2016 there were 3,487 permits and in 2017 3,470 estimated. Still it’s a decrease in 2017. Developers outside of Boston are moving from SFDU construction to multi-family housing. Two-thirds of today’s permits are for multi-family and not single family housing units.
Boston is projected to have a population of 724,000 by 2030. That population number is not as high as the pinnacle year of 1951 (over 800,000) but it’s still a high population. The greater Boston area has a population of 4.47 million with the inner core experiencing 14.9% of the population growth, the most of all sections. The growth will be accommodated with smaller homes. We need 160,000 new housing units by 2030 and it will be a challenge. From 2000-2010, the age group of 20-34 years old made up 73.9% of the population growth in this region. But this same age group in 2000 only comprised 34% of the growth. It has been increasing dramatically. It’s is basically the Millennials vs. the Seniors and these two age groups will spawn a new form of housing. Seniors want smaller housing. The 3 basics groups to house are the young millennials, working families and aging babyboomers and it will be a challenge.
The panelists then gave its market review and forecast.
Molly Heath, Cambridge
Heath broke down her review of Cambridge into 3 sections; West, East and Mid-Cambridge markets. She stated that Cambridge was one of the strongest markets globally due to tech and life sciences that have grown organically. The vacancy rate in the 3 sections of Cambridge range as follows:
Lab: 0.0% to 5.6%
Office: 0.8% to 5.9%
Rents: Lab $52.76 to 75.45 psf, NNN
Office: $50.00 to 81.23 psf, gross
The rents are the highest in the area. There is still room to run with rent increases as bachelor degree young workers make up 2.3% unemployment rate. These young workers are graduating from Harvard and MIT. In Cambridge, 56% of the residents are 20-34 years old.
In terms of recent E. Cambridge leases, Facebook took 132,000 s/f, Intersystems leased 238,000 s/f, Blueprint leased 100,000 s/f and Shire 221,000 s/f. Harvard U leased 61,000 s/f in Mid-Cambridge. Over 600,000 s/f of signed leases occurred in E. Cambridge with 737,000 s/f in demand for lab space and 1.2 million s/f for office. In total 3.3 million s/f of demand has come from outside of the market in the last 5 years.
What are the drivers?
Timing of the space delivery to meet the need to hire workers and be able to operate in the next months. Co-working has a demand of 190,000 s/f.
Supply as a driver
First, the speed to market is critical. If you are looking for 100,000 sf or more then you only have one option. 2017, 93% of the space under construction is leased. Buildings to be delivered in 2018 have 62% of its space pre-leased and 2019 is 0% preleased.
Two, landlords will continue to renovate buildings they own and plan to reintroduce to the market.
What’s in the Pipeline?
We will see new supply. Over 7.5 million s/f is in the pipeline. Divco just broke ground on its 400,000 sf building in E. Cambridge.
Looking Ahead
1. We see more spec development
2. Lab and office space will be a blur
3. There will be continued demand for co-work space
4. Cambridge space demand will spill over to other communities including Watertown, Seaport, Boston and Somerville.
John Carroll, Suburban Market
Carroll started his review stating that the suburbs are alive and well. There is 99.5 million s/f of occupied office space and that number is up 5 million s/f from 2007-08. Class A office are experiencing peak rents in the low $50’s, gross located in the Waltham market. There are a great deal of renewals and expansions. Expansion represent 10-19% of leasing activities and this trend will continue in 2018. Class B office space has 450,000 s/f slated for non-office use, housing and hotels that will bring balance to the demand for class B buildings.
Of the suburban office vacancy, 1.2 million s/f come from 6 buildings located in Marlboro, Framingham and Westboro. Currently there is a 14.7% suburban vacancy and demand will continue in 2018. The South Shore market is reaching historic rents due to the lack of office space. Developers are continuing to renovate S. Shore buildings to meet demand.
2017 Leasing Activity in Metro West
Currently the demand in MetroWest has come from Shark Ninja and NBC Universal. The 2018 demand will be strong including 220,000 sf in Waltham. We are now seeing new lab space coming on line in Waltham (rather than Cambridge) with new construction, space conversion and this will continue to push up rents.
Ron Perry, Downtown Boston
Perry stated that 2017 was the Year of Evolution. GE decided to move to the Seaport and then Reebok and others (such as JC Cannistraro that was handled by SIORs Cleary and Nahigian). There is a great deal of construction but mostly it is for residential use. Therefore there is limited commercial space being added to the inventory to help with the space shortage.
What are the key game changers?
Amazon is looking to add 900 jobs. PTC is relocating 1,000 jobs to Boston, Rapid7 is relocating its headquarters, Wayfair needs a home for 10,000 workers. The Boston office asking rents are now in the $45-85 psf range. The office vacancy in the downtown core is 8.1%; Backbay 9.6%; and Seaport 8.2%. The rents in the Seaport are low to high $50 psf and there is a big cluster of rents.
For office tower space:
20+ floors = 10% vacancy
2-19 floors = 9.4% vacancy
There is an even balance between the lower and upper floors of tower buildings but that will change in the future as tech demand wants higher floors.
Key Moves
There is an even balance between office and tech firms leasing space such as Santander, MintzLevin, Rapid7, Amazon and CloudHealth.
In the market, there is over 4.5 million s/f looking for space with the highest percentage coming from hi-tech. Demand is strong over the next few years. Migration is a big movement as well from firms moving to the Seaport, Boston and BackBay. The demand is also from different industries. Migration of firms is 20% of the leasing expected in 2018.
Availability of space can be limited depending on size. If you are a tenant looking up to 10,000 sf, then you have 72 options. But if you are 100,000 sf then you have only 8 options.
New Development
There is over 11 million s/f in the pipeline but only 10% of this space is actually under construction. The Seaport has 1.5 million s/f planned; Government Center is 6.8 million s/f and S. Harbor with 3.39 million s/f. New construction will cost $700 psf and that will translate to an asking rent in the $80s gross. Deduct $20-25 psf for operating expenses and real estate taxes and the net rent is $55-60 psf or 7.8% to 8.6% returns.
Trends
There is plenty of inventory to satisfy demand and Ron doesn’t feel that Boston will be overbuilt. The vacancy is now 8% and will decrease to 7%. This decline will give a gradual increase to office rents. Co-working space will continue to grow.
JR McDonald, Industrial
McDonald started that investors and developers are trying to get into the Boston market for industrial development. This is a major change from the last 30 years. In Boston the trend is that the industrial asset is now a winner. E-commerce is a new driver for demand. This demand is pointing to new development. Infill and urban sites are now red hot.
Past 5 years
The total return for industrial investments was 12.8% in the last 5 years and this return outstripped retail and multi-family development. Retail has a 12.1% return in the last 5 years. The 6 largest distribution markets broke down as follows:
California #1, Texas #2, Georgia #3, Illinois #4, Pennsylvania #5 and New Jersey #6. There is a transformation occurring at warp speed with Walmart increasing its online sales in 2016 at 63%.
In 2016, 78% of US population decorated Christmas trees; 52% had Amazon Prime and 49% own a landline telephone. Boston had old school companies that have transformed. These old school regional retailers included Jordan Marsh, Ames, Lechmeres and Filene’s Basement.
The last mile is now a gold rush that everyone wants to chase with vans on urban streets to deliver and fuel demand in Boston.
Warehouse in 2017
The total inventory is 100 million s/f. The average rent is $6.63 per s/f. The overall vacancy is 5.6% and the absorption rate was 470,087 s/f. We are ready for new development. Problem however is that users are competing for the same buildings that are also being bought for luxury housing thus removing potential industrial inventory. So now the suburbs have to make up the demand needs such as in Dedham, Revere and Norwood. The average asking rents in Boston is now in a high range of $9-11 psf NNN. There is a great deal of clustering in the same areas. There are some rents reaching $20 per s/f in the inner areas and rent isn’t a function of the building but the location. The industrial future in 2018 is bright. Keeping up with the pace of change will be important.
Ben Sayles, Capital Market
Sayles wrapped up as the last panelist. He summarized the capital market status by saying that capital remains abundant but is nervous. Closed end funds are up $277 billion in the 2Q ’17 with $750 billion in 1Q ’17. The total in 2007 was only $83 billion as a comparison. There is no slow down. Life companies are the best of the best in pricing rates. Banks are strong. The CMBS market is a great source of funds. Bridge funds will be the deepest part of the market.
End of Cycle
The end is abated and no one is concerned about when this cycle will end. If investors sell, then the key problem still remains what to do with the cash? So no one wants to sell. Cap rates are experiencing a 140 bps spread. There is a flattening yield curve but borrowing costs are increasing. Financing volume is up and lending volume is up 7%.
Where is the capital headed? Who are the buyers?
The hottest cities in the US are as follows:
LA #1; Dallas #2, NYC#3 and Boston is #6. Investors are pulling back from NYC on the sell side.
Foreign Capital
Most of the international money is headed to NYC and some to the U.S. heartland but mostly staying on the coasts. Asia-Pacific investors represent $28.4 billion of capital in the U.S. and are #1 as U.S. foreign investors. Japan could be crazy investors as they have increased interest for U.S. real estate. The Morgan Stanley funds were also big investors in 2017. They had a $1 billion in sales and refinancing. Suburban office is the most missed investment and can get better with wider investment spreads over the Boston core real estate. Class B space has a bigger run in the future. Lab will be a big choice and industrial is everyone’s hottest asset.
Cap rates are real low and that will change.
* 250 Summer Street, Boston sold June,’17 at 3.7% cap
* S. Station, Boston sold Aug. ’17 at 4.5% cap
* 625 Mt. Auburn, Cambridge sold Aug.’17 at 5.3%
* 93 Summer Street, Boston, Class B office, under agreement at 5.5%
Investment Choices
#1 is Industrial anywhere in the Boston area
#2 Class B space will have opportunities
#3 Life Sciences
Supply
2018 will be like 2017 with constrained opportunities. We will have cap rate compression and value will continue to increase. Capital from sources such as sovereign families, hi-net worth individuals will migrate to search suburban properties. More and more people are also coming to Boston.
MORE FROM Owners Developers & Managers
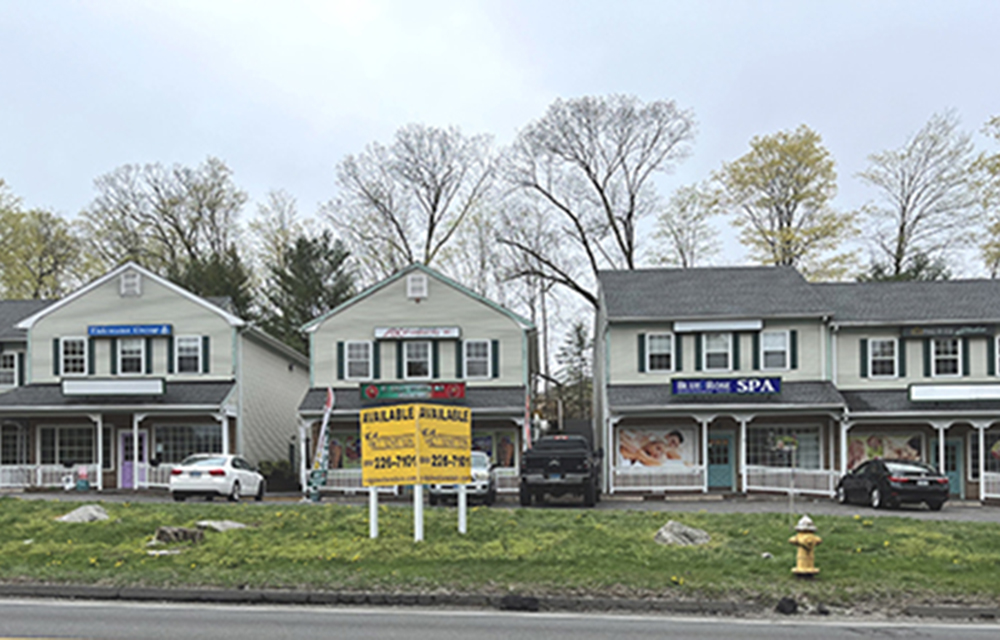
Crescent Village Shopping Center trades to new owner for $1.75 million
Monroe, CT Crescent Village Shopping Center located at 115 Main St. has been sold to new owners. The multi-building retail center sold for $1.75 million or just under $142.00 per ft. The three buildings total 12,340 s/f on 1.54 acres


Quick Hits


Columns and Thought Leadership

Florida ruling raises bar for condo terminations and buyouts - by Michael Karsch
On October 14, 2025, in a landmark decision with significant implications for the Florida real estate market, the Supreme Court of Florida formally denied Two Roads Development’s (TRD Biscayne LLC) petition for review in its long-running case against unit owners of Biscayne 21,

IREM president’s message: Our new reality - Staying ahead of supply chain delays - by Yoany Vargas
Supply chain delays are slowing construction, ratcheting up operating costs, and extending turnover timelines across Greater Boston, directly reducing revenue and increasing the workload for multifamily and

Revitalized Town Centers: Retail??? - by Carol Todreas
It is now widely accepted that customers want to shop in person at physical stores. Brands know that they do better business in a physical store than just on line so they want to open stores. Demand for retail space by digital merchants, local entrepreneurs, and newly developed national chains

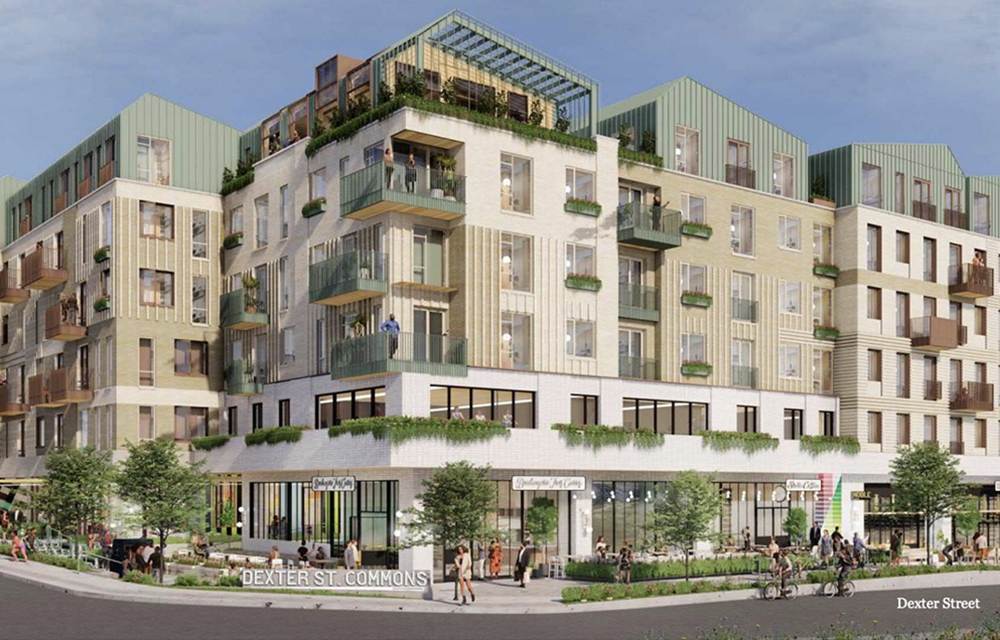
Retail infill strategy to activate Pawtucket’s Conant Thread District - by Gaetan Kashala
Until recently, the Conant Thread District consisted of approximately 150 acres of underutilized industrial land spanning Pawtucket and Central Falls. Today, the area is one of the most significant