 (1).png)
News:
Owners Developers & Managers
Posted: August 4, 2016
Observations on Boston’s industrial markets: A temporary slow down or a recalibration? - by Webster Collins
 Webster Collins, CBRE/New England
Boston’s industrial market cycles have proven to be very long. The market struggled for 13 years with vacancy rates of 18.8% to 25%. It was not at all unusual for an industrial property to take two years to lease. Tenants who leased would expect two months free rent on a five year lease and turnkey build out for their use. It would not be at all unusual for up front costs to equal one year’s rent.
Gradual absorption took place between 2010 to 2013 where vacancy rates were worked down to under 15%. 2014 and 2015 were record years with strong absorption moving vacancy rates below the magic 10% number.
A long held belief exists that 10% is a benchmark vacancy rate. New construction is expected to start when vacancy drops below 10%.
 Q1 2016 – A Strong Start
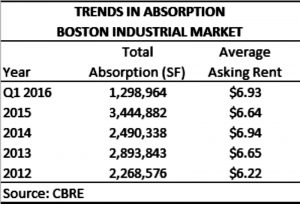
The Greater Boston industrial market continues its 2014 to 2015 momentum into 2016. As shown in the attached table, Q1 2016 produced 1,298,964 s/f of absorption.
Q1 2016 – A Strong Start
The Greater Boston industrial market continues its 2014 to 2015 momentum into 2016. As shown in the attached table, Q1 2016 produced 1,298,964 s/f of absorption.
With limited new construction taking place, vacancy dropped to 9.2% in one quarter alone. Rents which in 2012 were at $6.22 per s/f were rising and at $6.93 per s/f were up a healthy 11.4%. The Rte. 128 South market was the strongest of all submarkets with 797,747 s/f of absorption representing a 61% market capture in an eleven sub market industrial sector.
Q2 2016 – A Temporary Slow Down or a Recalibration? Markets ebb and flow, and in our relatively small market, a few deals or vacancies can move the needle. The second quarter slow down can be attributed to a few market elements, not to mention the typical slowdown seen in summer months. However, Boston did witness a few recent consolidations from M&A activity as well as employment of new distribution strategies. Q2 2016 average asking rents slipped to $6.84 per s/f and absorption was 222,291 s/f, 17% of Q1 2016’s absorption. While some evidence may suggest a slowdown, other data suggest a pause in the action as the Greater Boston Industrial market continues to be supply constrained for large users.
Q3 2016 – What the Pipeline Tells Us Q2 2016 is just a short pause while the market recalibrates. As suggested above, speculative construction has started. TA Associates Realty is under construction in Taunton with 200,000 s/f. Conroy Development is under construction in Mansfield with 94,000 s/f.
Leases or purchase and sale agreements are out for signing. At Devens, Nestle is targeting 135,000 s/f. There are two 100,000 s/f transactions in Holliston and Hyde Park. 60,000 s/f from the Boston Flower Exchange is moving to Chelsea. Amazon is taking 160,000 s/f in Milford and Costa Provisions 240,000 s/f in Avon.
In real estate it is all about making the right moves and those moves are happening in the industrial market. The supply side of the Boston market for large users is constrained. A deal originally targeted for 400,000 s/f in Boston went to Connecticut because a building of this size was not available in our market.
Conclusion Market statistics can tell a misleading story. They suggest a lull in tenant demand as indicated by Q2 2016 numbers. This is not the case. The investor appetite for suburban industrial remains strong, particularly in the flex market. The flex building market at 30 million s/f is the smallest of the three classes of space (high bay, general, flex) that make up the market.
In conclusion, we do not want to misread the data out there. Q1 2016 was a record 1,300,000 s/f of absorption and Q2 2016 is a justifiable breather. The above listed deals total 795,000 s/f alone. Q2 2016 is an outlier and represents random event of deal timing. Markets ebb and flow. There is no ebb to the Boston industrial market.
Webster Collins, MAI, CRE, FRICS is an executive vice president within the valuation and advisory group of CBRE, Boston.
MORE FROM Owners Developers & Managers

The Westin Portland Harborview to host exclusive VIP pop-up with The Woods Maine July 24–26
Portland, ME The Westin Portland Harborview will introduce an exclusive, limited-time pop-up shop with The Woods Maine, taking place July 24–26 in the city’s Arts District. This elevated retail experience brings The Woods Maine, the acclaimed Maine lifestyle brand behind the popular retail shop in Norway, Maine, directly to hotel guests and the local community.


Quick Hits


Columns and Thought Leadership

IREM president’s message: Our new reality - Staying ahead of supply chain delays - by Yoany Vargas
Supply chain delays are slowing construction, ratcheting up operating costs, and extending turnover timelines across Greater Boston, directly reducing revenue and increasing the workload for multifamily and

Retail infill strategy to activate Pawtucket’s Conant Thread District - by Gaetan Kashala
Until recently, the Conant Thread District consisted of approximately 150 acres of underutilized industrial land spanning Pawtucket and Central Falls. Today, the area is one of the most significant

Revitalized Town Centers: Retail??? - by Carol Todreas
It is now widely accepted that customers want to shop in person at physical stores. Brands know that they do better business in a physical store than just on line so they want to open stores. Demand for retail space by digital merchants, local entrepreneurs, and newly developed national chains

Florida ruling raises bar for condo terminations and buyouts - by Michael Karsch
On October 14, 2025, in a landmark decision with significant implications for the Florida real estate market, the Supreme Court of Florida formally denied Two Roads Development’s (TRD Biscayne LLC) petition for review in its long-running case against unit owners of Biscayne 21,