Markets recover differently depending on product type. This is one of two companion articles which describe the apartment* and office markets. In this case, I will study the office market, start with basic economics, analyze supply and demand, and then present conclusions.
The Power of Analysis
The primary determinant of the strength of the office market is employment. For every office oriented job, one employee will use approximately 250 s/f; 4,000 employees represents 1 million s/f.
The national office market is projected by Torto Wheaton Research to recover all office jobs lost since Dec. 2007, by Q2 2013. For Boston, my analysis of Moody's Economy.com says that we will beat national markets by 1 year and begin office market recovery in mid 2012.
Moody's indicates a 36,900 job loss for Greater Boston in 2009. Through Q3 2009, there has been 4,651,690 s/f of office absorption which translates into a loss of 18,600 office jobs. Annualized there would be a 24,800 office job loss. If on average 67% of all jobs lost relate to office, negative absorption numbers in the market and jobs lost carry close to a 100% correlation.
For 2010 as the market recovers, with an additional 14,900 job losses projected, we may expect to see an additional 2.5 million s/f of absorption.
Supply and Demand
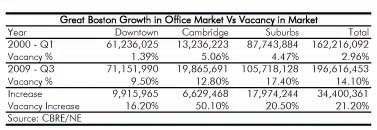
Between Q1 2000 and Q3 2009, a total of 34,400,361 s/f in new office construction took place.
What has happened is that job growth projections to support construction did not happen. The rose colored glasses worn in 2000 were of the wrong tint. The office market overbuilt itself.
Moody's in 1999 reports there were 1,099,400 jobs in the Boston-Quincy economic area. Today that number is 1,092,600 jobs for a no job growth scenario over the past 10 years.
The office market overbuilding was caused by:
* The CMBS market and availability of easy money.
* The excess supply of capital chasing real estate.
* A Federal Reserve policy of reduction of interest rates below traditional levels.
From employment statistics and a study of supply and demand, we can reach the following conclusions.
Conclusion
In 2000, we were an under supplied market. Because of no job growth this past 10 years, we are now an oversupplied market.
New construction requires rents to support cost. Average rents were at their peak in Q2 2008 at $35.96 per s/f for the market as a whole. As of Q3 2009, average rent is $30.57 per s/f. Average rent Q4 1999 was $30.06 per s/f.
In our study of the office market, the only markets that can truly justify new construction are specialty markets such as high rise office or lab buildings. This occurs only occasionally in any 10 year cycle and projects will be few in number. Construction will only take place when rents recover with an expected date beginning in 2013.
In the meantime, the recovery period is expected to be long. Between now and 2012, based on job statistics, there will be at most a demand for 7.25 million s/f of space. When deducted from current availability of 39,584,782 s/f as of Q3 2009, when we look up in 2012, there will still be 16.4% availability.
This time around we are seeing no speculative capital in the market which will stop speculative construction. With no speculative construction, increased competition will not be a factor impeding recovery.
In the meantime, there will still be a lot of pain in the office market. Those that over levered office real estate with mezz debt, will be forced to give back their properties.
On a market-by-market basis, with Q3 2009 availability of 23.1% and actual vacancy of 17.4%, the suburban market is being hit the hardest. Landlords are decreasing rents and minimizing tenant improvement dollars.
The downtown market despite financial sector pull backs is the strongest with only a 9.5% actual vacancy. At the same time, average asking rents have plummeted from $56.31 per s/f Q1 2008 to $43.92 per s/f Q3 2009.
The office market is a tale of two markets by itself. Where as over leveraged properties sell at cents on the dollars when vacancy materializes, strongly leased properties sell at equally strong pricing. The story of One Winthrop Sq. is most interesting. While this property was purchased on June 23, 1999 for $24,802,500, it carried a positive cash flow for ten years and when time came to sell on July 24, 2009, still commanded $21 million despite far weaker market conditions than those of 1999.
Overall, this time around there is no RTC to create in market value terms what is called "undue stimulus". The market I see is one where forced write downs are being taken only if vacancy and over leveraging are the cause. The "flip" days of the early 21st century are over and well leased, cash flowing office property is looked at as an attractive investment, particularly in light of other capital investments where cash flow is miniscule.
(The apartment article, which appeared in the 10-23-2009 Appraisal Expo issue, can be viewed at http://www.nerej.com/35855).
Webster Collins, MAI, CRE, FRICS, is executive vice president/partner within CB Richard Ellis in their Valuation and Advisory Group, Boston.
Tags:
The recovery from recession - The tale of two markets - The office market
October 27, 2009 - Spotlights


