EDC of the Month: In retail site selection, it’s “show me the DATA!” Rochester has seen 1 million s/f of new development

Technology is changing everything about the shopping experience, including the latest millennial trend of “click-and-collect” to describe shopping online and picking up in a brick-and-mortar store. Mobile devices and BIG DATA have had the same transformative effect on site selection for retailers. Traffic counts and “Main-and-Main” locations are now just the beginning of the conversation, savvy site selectors are well armed to go to the next level and delve into psychographics, consumer propensity and custom mapping.
National retailers have lived in this space for years, and with Amazon-like precision, have been identifying and selecting new store sites equipped with an arsenal of data for each expensive investment decision. Predictive analysis will even identify similar stores the chain already has and estimate sales for the new location with laser accuracy. While developer relationships are still critical, and a great deal can triumph over some site flaws, neither aspect will overcome a site that analysts won’t support.
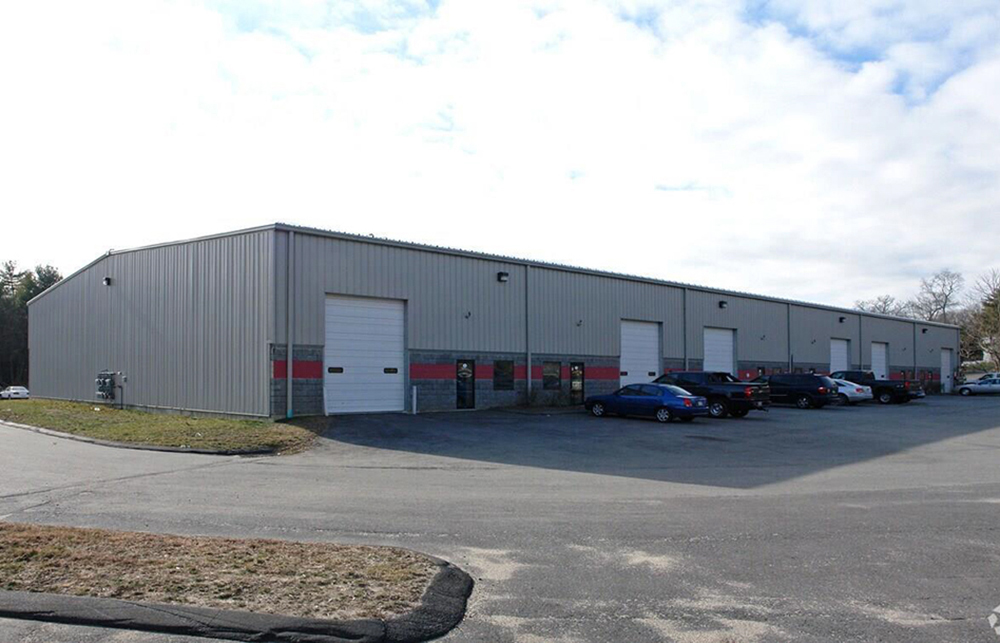
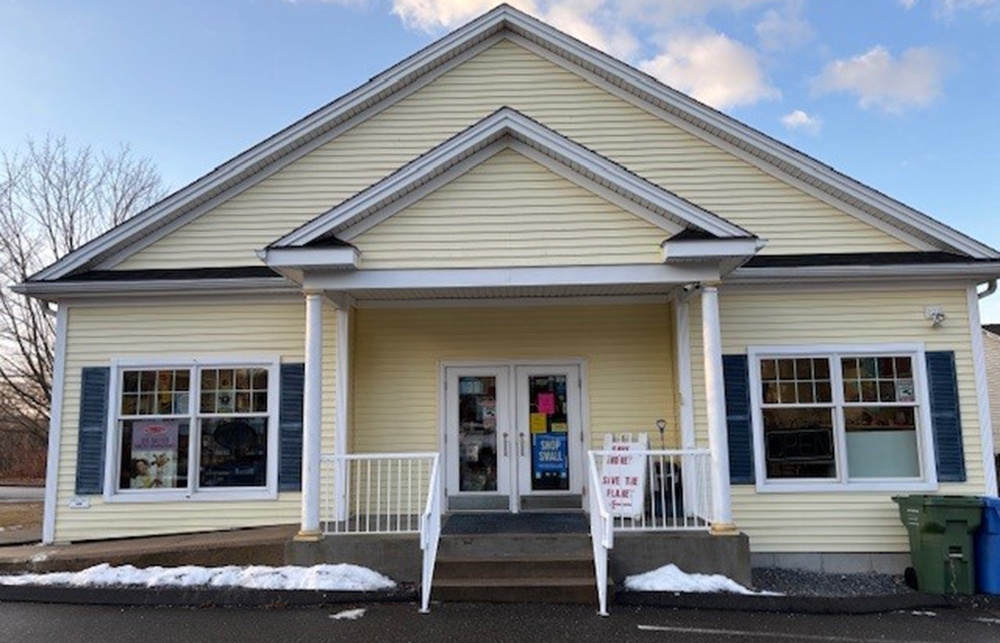
How can business attraction professionals get through to retailers and make a case for their sites? Add quality data to your development toolkit. Rochester, N.H. has recently seen 1 million s/f of new retail development when they added retail data and analytics from the Buxton Company of Forth Worth, TX. to the mix. An underserved community of 30,000, Rochester is an hour north of Boston and had been unable to be seen as competitive contenders for large retail developments. With the aid of analytics using the target scope of a 30 minute drive time, the community refined the approach to select the correct retailer and to eliminate those who were least likely to be a retail match. Selecting the right targets increased efficiency and the economic development staff could focus on those restaurants and retailers most likely to come to the city and be successful. The data was also used to create custom attraction packages that addressed competition in the marketplace, consumer behaviors and store comparisons within their chain. For example, a restaurant that is a retail match to Rochester would be estimated to be similar to the one the company has in Saratoga Springs, N.Y. or Castle Rock, CO. This is very appealing to store development staff and can be used to begin a dialogue about future locations using objective criteria.
This data has other community uses as well. Rochester is utilizing this data in a campaign to attract a beer brewery and/or brew pub for the downtown Arts & Entertainment District.
The 30 minute drive time (Map) has 80,053 households and of these, 23,621 or 30% show a propensity to drink craft beer or go to breweries. In the full report Buxton said, “Brewery/craft beer customers also have known interests in sports, outdoor activities, personal travel, home décor, children’s products, and tend to lead an affluent lifestyle.”
Experian’s Mosaic USA consumer lifestyle segmentation data is used to determine how large the target audience would be for this activity. Each of the following classifications, sports utility families and aging Aquarius, are 6% of the Rochester market area:
• D15 sports utility families, which is defined as “upscale, multi-generational households of middle-aged couples with school-aged children living active family lifestyles in outlying suburbs.”
• C11 aging Aquarius is comprised of upscale boomer-aged couples living in city and close-in suburbs.
There are 71 different categories or niche markets that can be defined, and in Rochester 30% of the residential population would enjoy visiting a brewery or a craft brew pub. The more you can understand your trade area, the easier it is to identify and attract retailers who fit best.
Various lifestyle characteristics are indexed, with 100 being the national average. With scores well over 100, sports utility families are very likely to enjoy a variety of outdoor activities which will be very attractive to sporting goods companies and recreation-oriented companies.
Destination retailers will be interested in longer drive times, however the average for fast food is 5 minutes and the typical retailer is 30 minutes. Rochester can create custom maps using radius, drive time or other polygons as deemed appropriate to the situation with reports generated from the shape map.
What does the future of retail site selection look like? It is still an art built on relationships and trust, infrastructure and traffic counts, proximity to markets and corner traffic signals. With technology and big data now playing a prominent role to saying, “yes,” to new locations and investment opportunities, communities must step up the mobile site selection communication methods.
Online shopping and mobile Apps are rapidly changing the customer experience, but they will not eliminate the demand for a robust shopping experience. Retailers, developers and communities must adapt to the new landscape and bring analytic data to the table. In that way they can contribute to the location decision conversation more than windshields and rooftops. You will be delivering an identified pool of consumers which makes your location irresistible to the real estate committee. This deeper understanding of the marketplace gives you the competitive advantage regardless of community size.
Karen Pollard, CEcD, is economic development manager for the City of Rochester, Rochester, N.H.
RapDev leases 17,587 s/f at 501 Boylston St. - lease brokered by JLL


Retail / tariffs / uncertainty and (still) opportunity - Carol Todreas
As new tariffs continue to impact the global economy, retail businesses and investors are grappling with heightened uncertainty. From new high tariffs to supply chain issues to evolving consumer behaviors, continual changes are making it as or more challenging than the pandemic years. Yet, amidst this turbulence,

Newbury Street: Boston’s timeless retail gem thrives in a modern era - by Joseph Aquino
Boston’s iconic Newbury St. continues to thrive as one of the most vibrant and compelling retail corridors in the United States. Nestled in the heart of the Back Bay, this historic St. has evolved into a powerhouse of high-St. retail, where luxury meets lifestyle and legacy brands coexist with up-and-coming names. With its European charm, diverse architecture, and unmatched foot traffic, Newbury St. remains a dynamic reflection of Boston’s energy, culture, and economic strength.

Placemaking and retail in 2024 - by Carol Todreas
Placemaking. That is the word for 2024. While the concept has historical precedence in urban development, it became part of our current culture in the 1960’s when urbanists started to think about cities for people, not just cars.


.png)
