
News:
Spotlight Content
Posted: February 8, 2008
SIOR/NAIOP hold market forecast for 2008 on Nov. 29th
The New England Chapters of SIOR and Mass. NAIOP held the annual commercial real estate market forecast for 2008 on Thursday, November 29th. The forecast attracted over 450 commercial professionals to the Seaport Hotel to hear the economic overview from Hans Nordby of Property & Portfolio Research, Inc. and a panelist of experts. The panel included Kristen Blount of Meredith & Grew on the downtown Boston market; Mark Winters of Cushman & Wakefield on the Cambridge market; Mike Smith of JLL on the investment market; Brian Hines of DTZ FHO Partners on the suburban market and Bob Gibson of CBRE on the industrial market.
Here is a summary of each expert's overview.
Hans Nordby: Economic Overview
Hans gave the audience review from one year ago and mentioned how the industry marveled at the investment market and wondered then how much longer the market could sustain.
The Economy
The US GDP is closer to 2% rather than the anticipated 3%. There are 1.5 million jobs and risks are mostly on the downside. The housing market continues to weigh on the economy. Foreclosures will continue to be an issue although inflation is easing. Job growth will be tough in 2008 because unemployment is quite low. The U.S. could be in a recession now but it is difficult to know.
Since September 2005, the trend has been down with job growth. Of industries with growth, we see strong growth with leisure and hospitality (due to strong business travel spending), education, health services and wholesale trade. Weak industries include manufacturing (mostly due to the auto industry) and construction. We are producing a lot more now with less cost.
Boston population growth is 0.3% while the U.S. has been about 1% so Boston is not in bad shape. The strongest population growth market is Salt Lake City and the weakest is Detroit. Boston is about two-thirds from the strongest on the scale.
Income growth is beginning to exceed consumption growth; which is good news. Past due loan delinquencies are the worst in Michigan due to the auto industry then Texas, Louisiana, Georgia (Atlanta has a lot of mortgage fraud). Real capital market flows sees debt change every 10 years and now we are in that 10th year. Commercial loans are not sub-prime and the CMBS delinquencies have decreased from April '05 to June '07 down to 0.25% of total loans. The sub-prime ARM loans has increased in June'07 to 1.35% of total loans. The holders of commercial mortgages have a problem because no one is sure where new money for future loans will be evolving. The traditional lenders such as life insurance companies and pension funds have decreased their allocations in March '07 to 12% of its total. CMBS market decreased to 25% in March '07. The depository institutions decreased to 58% but banks are looking for real estate debt and that should help.
Boston Real Estate
Boston doesn't behave like the rest of the U.S. and will continue to experience supply tightness in the next two years. We have about the same supply as 2002. Miami is in bad shape with 5.4% of new construction to existing inventory ratio. The U.S. average is 2.2% of new construction to existing inventory. Boston is a little more than the U.S. average. Boston Class A space is experiencing rent growth. Rte. 128 vacancy rate is 16% which isn't bad. The Boston CBD August '07 vacancy was about 3%; Class A was 7% which was the vacancy rate in July '06. July 2006 was the peak vacancy of 16% for Class B space. The industrial demand wave has crested; growth will be lower in 2008 with net space absorption. However, the national supply pipeline is slowing.
Bob Gibson, CBRE on the Industrial Market
Gibson started by stating that space availability is up, cap rates are up and broker incentives to rent space is up. Total space absorption is down, demand is down, quality option to lease is down and new construction is down. Tenant velocity is flat and user purchasing prices has flatten out.
The total Boston area market consists of approximately 134 million s/f with a 15.9% vacancy. In submarkets:
* Metro North: $8 per s/f, NNN is the average rent; $60-70 per s/f, average price and 16% vacancy
* Metro West: $6.65 per s/f, NNN is the average rent with 20% vacancy
* Metro South: $5.72 per s/f, NNN is the average rent with 13% vacancy.
* Urban area: $8.50 per s/f,NNN is the average rent with 23% vacancy
The average greater Boston absorption was trending up and now 250-500,000 s/f was absorbed. Of the transactions, 75% was warehouse/distribution and 25% was manufacturing. Of vacancies, the mean building size is 98,000 s/f; median building size: 75,600 s/f. 65% of the available buildings were built by end-users or 10 million s/f of space for manufacturing use.
Brian Hines: DTZ FHO Partners, Suburban Office/R&D Market
This particular market is smaller than the office market but more popular. Here are some stats:
* Total market size: 124.5 million s/f
* Vacancy: 19.9%; U.S. vacancy: 23.3%
* Under construction: 1.2 million s/f
* 10 year average absorption: 1,012,074 s/f average while we have 20 million s/f available
* 2004-06 absorption: 3,049,592 average
* Rte. 128 has 17% vacancy; Rte. 495 has 25%; 2001-02 we had a negative absorption and we are still trying to catch up. In 2007, we are projecting 3 million s/f to be leased.
* Construction costs with land is about $250-300 per s/f and land can cost $100 per s/f or more. You need higher rents than what is being achieved so there is little incentive for new construction.
* Very little space is leasing for less than $20 per s/f and very little is leasing for more than $40 per s/f. So we have a tight range of $28-32 per s/f, net electric. There is modest growth in demand for our region. On a scale of 1-10, we are at 5 for tenant demand. There will not be any big run up in office rents and new construction will be sporadic.
Mark Winters, Cushman & Wakefield on Cambridge
There has been slower tenant demand. The office supply is 10 million s/f and mostly 20-25 years old. The total lab space equals 7.5 million s/f. There has been no office construction so rents have increased. Four companies had demands equaling 1.6 million s/f out of the 1.7 million s/f that was available. The drivers have been big pharmaceuticals, organic growth tenants and incoming demand. Most of the office demand is under 50,000 s/f per demand and the average lab demand is 47,548 s/f. But take out one tenant and the demand average is 24,925 s/f.
There is a 30-40% lab rent savings going to Rte. 128 but not sure who will go. Most rents are in the $45-55 per s/f rent. Rent growth could be 67% with lab rent growth at 17% in the next 18 months.
Kristen Blount, Meredith & Grew on the Downtown Boston Market
The vacancy is 9% with rents in the $45-80 per s/f range. There is 56 million s/f with 1 million s/f leased. Class A tower space has 2.6% vacancy over 20 floors with rents in the $65-80 per s/f range. Below the 20th floor, there is a 5% vacancy with rents in the $45-60 per s/f. The 2007 projected vacancy is 8.8% and could be at 5.8% by 2010. Demand outlook is 15% per year in growth with declining space alternatives. The fundamentals are strong but rents will rise moderately. The flight to value will continue.
Mike Smith, JLL on the Investment Sales Market
Smith stated that 2007 was an amazing year due to the high volume of deals. Sales in the first 6 months of 2007 eclipsed the total for 2006 which then was a record. So 2007 has been amazing but the debt market has changed. It was a seller's market and now that has gone. It was very difficult to buy properties in Boston and demands from sellers were out of whack. Lenders are now forcing buyers to price risk into transactions. There are lower LTV ratios, increased spreads, recourse financing.
Buyers today are the baby boomers and they are not sure where the market is going so they are waiting. Six months ago, bidders were in the same bandwidth and now they are wider apart. Bidders are upping their bids by 50% on second go-around offers. Going into 2008, equity will show its face. The largest ownership change in Boston occurred in 2007 with the following breakdown for tower market purchases:
* 34% private
* 7% REITS
* 9% institutional
Investors still feel that rents can rise and 2008 will have a tug of war between sellers and buyers. Holding periods will be longer. The large portfolio sales have been shut down and foreign capital cannot move fast enough as in the past. But they will be involved in 2008.
We would like to thank our sponsors CBRE, Cushman &Wakefield, Meredith&Grew, DTZ FHO Partners, JLL and Banker & Tradesman.
Tags:
Spotlight Content
MORE FROM Spotlight Content

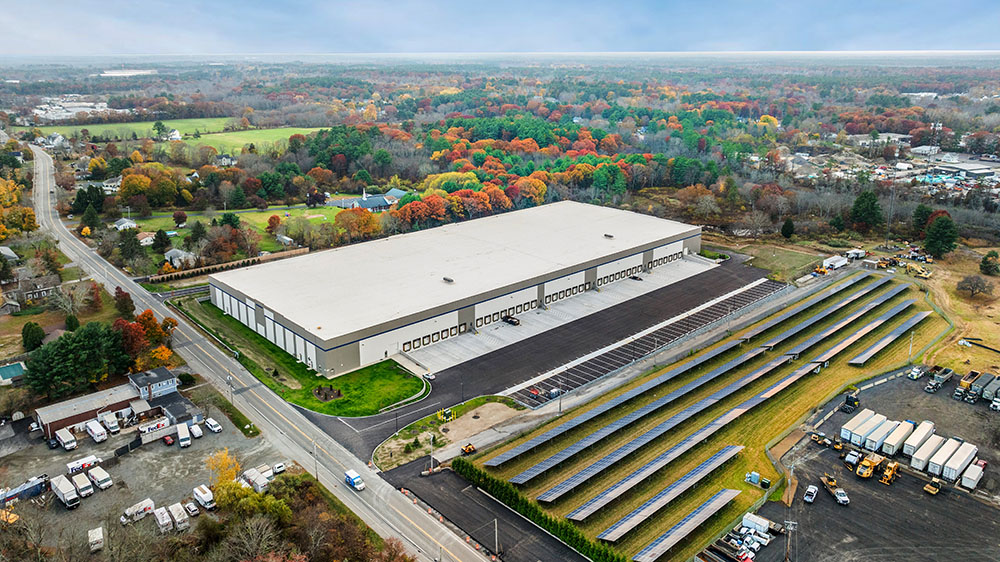
NEREJ's 2026 Industrial Review Spotlight
The New England Real Estate Journal is pleased to present Industrial Review 2026, a special publication highlighting the people, projects and properties shaping New England’s industrial real estate market.


Quick Hits

Columns and Thought Leadership

Limited supply fuels landlord‑friendly conditions in Rhode Island’s industrial market - by Julie Freshman and George Paskalis
As we enter the spring of 2026, the Rhode Island industrial real estate market stands on stable footing, following several years of resilience fueled by constrained supply, steady demand, and dynamic economic conditions.

Shallow-bay wins on 495/128: A renewal-driven market with a thin pipeline - by Nate Nickerson
The Boston industrial market entered mid-2025 in a bifurcated state. Large-block vacancy remains elevated, while shallow-bay along the 495/128 corridor continues to prove resilient. Fieldstone’s focus on this geography positions us squarely in the middle of a renewal-driven, supply-constrained

How do we manage our businesses in a climate of uncertainty? - by David O'Sullivan
These are uncertain times for the home building industry. We have the threat of tariffs mixed with high interest rates and lenders nervous about the market. Every professional, whether builder, broker, or architect, asks themselves, how do we manage our business in today’s climate? We all strive not just to succeed, but

As legacy names recalibrate, new entrants are moving in with fresh capital, new technologies, and business models tailored to today’s supply-chain needs - by Michael Harrington
Southern New Hampshire’s industrial market has always punched above its weight. For decades, the region has attracted a mix of advanced manufacturing, beverage and food producers, logistics operators, and specialty
